How we published a successful dataset on Kaggle
And how it helped spreading our company data efforts
I first visited Kaggle website about one year ago. I was attracted to solving some basic machine learning problems (such as Titanic: Machine Learning from Disaster). I found out it was also a great place to work on other people datasets, and to share your own data as well.
At
that time I worked in a large corporation with very strict compliance
rules. Sharing any data would be simply impossible. But the idea
persisted in my mind. Some time later, I left that big corp and started
working at a medium sized startup called Olist.
We are the largest department store inside Brazilian marketplaces. Our
catalog has over 200k products and more than 4 thousand sellers sell
their products through our platform.
There
we had enough lack of bureaucracy to get that idea of publishing a
dataset out of my head. I first brought the idea within the company
about five months ago, but it was very immature at that time. Some
questions were raised, such as:
- What we should publish? Why?
- Would someone use our data? How?
- And… What if any competitor uses our data?
Over
the next months the idea evolved and all questions were being answered.
Then, after some development process, we were finally ready to share
some data. And we did it on Kaggle about two months ago. The purpose of
this article is to explain how we published the data, and guide you in
this process. Maybe we even encourage you or your company to publish
some data as well.
What did we publish? Why?
We
decided to publish a dataset with orders and their customer reviews.
That would allow solving some classification problems. Our data science
team had already made some models to classify reviews, so we would love
to see how other people would approach the same problem.
To allow that we decided to release two datasets:
- A classified dataset with about 4k orders and reviews (only on version 5 or lower).
- A unclassified dataset with 100k orders.
Why
100k? Well… It was kind of a magic number: bigger than most public
datasets on Kaggle. Large enough to provide in depth analysis and for
different product categories.

The
dataset has information of orders made at multiple marketplaces in
Brazil from 2016 to 2018. Its features allows viewing an order from
multiple dimensions: from order status, price, payment and freight
performance to customer location, product attributes and finally reviews
written by customers. Latter we also released a geolocation dataset
that relates Brazilian zip codes to lat/lng coordinates.
Click here to check the dataset latest version

What data did we share?
First,
we published a real dataset. By using our data one may draw some
conclusions about the Brazilian e-commerce. We wanted to give a complete
sense of what kind of challenges our data team were facing. So we
publish as many information as possible. Our only constraints were to:
- Not release our product catalog (such as titles, descriptions and photos)
- Not release any customer information
- Not release any partner information
With
that in mind we created a dataset with more than 30 features. It allows
exploring an order from multiple perspectives, such as order
fulfillment, product categories, geolocation, customer satisfaction, and
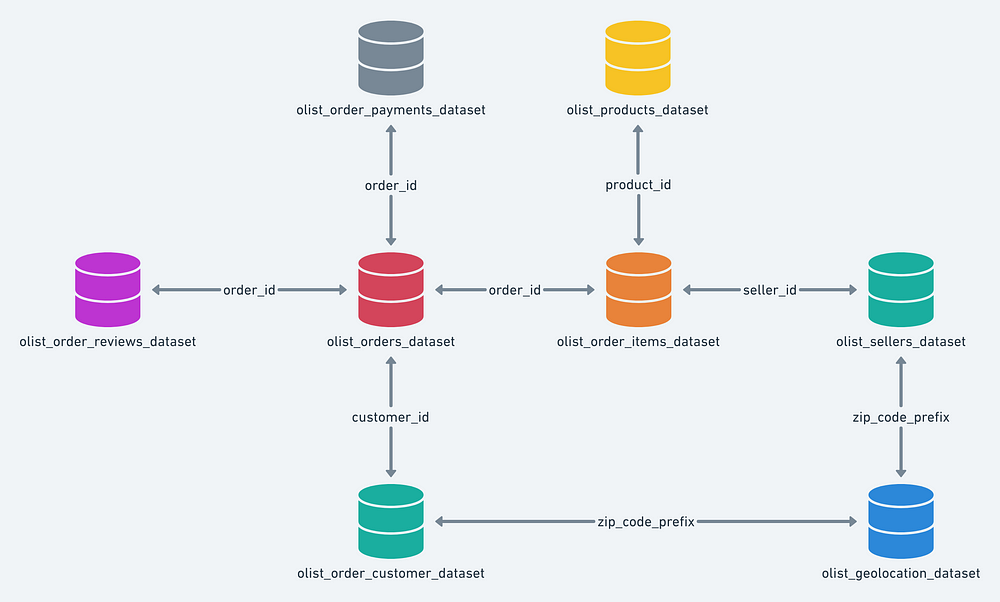
the list goes on. Bellow we show how the data is structured.

You
may notice that it reflects a real life situation, where data is stored
in multiple tables and sources. This structure is quite different from
the average dataset published on Kaggle.
The
dataset is well documented, all features explained and enough context
was given to allow everyone understanding the data. We created a
discussion topic encouraging people to ask questions and then coded a
starter kernel with some really basic analysis. That’s all.
Why did we publish it?
There are a few reasons that made us publish the data initially. But now that we did, we have even more reasons. They are:
- Contributing to the data community with real, good quality data. We have already seen it being used in college classes.
- Position Olist as a reference in the Brazilian data science community. After publishing the dataset we noticed other companies asking us for guidance.
- Attract good candidates to our team. It is a lot easier to create empathy and explain what we do by sharing the data. We have already contacted some people who analyzed our data with public kernels.
- See some problems from other people’s perspective. Many people contributed with public kernels, by reading them we are discovering different approaches to problems we are working on.
- Test candidates. The first step of our selection process now is an open challenge with the dataset.
- Fill-in the lack of public databases with text in Portuguese. Help the NLP community in Brazil.
- It also helped us to position the company as domain expert. Having this dataset public is working as a kind of certificate saying: trust us, we know what we are doing.
How it redefined our success metrics?
We
benchmarked with other public datasets on Kaggle to define what would
be success. And we were very modest, at first we thought that having the
following would allow us to say the initiative was successful:
- More than 50 upvotes in two months (we had 200)
- More than 500 downloads (we had 3.4k)
- More than 5k views (we had 24k)
- More that 5 public kernels (we had 21)


This also answered our second question: our data was being used!
What if any competitor uses our data?
That’s
a risk. But if they would really like to use it, they would find a way
even if we didn’t make the data public. Aggregation of our data may
already be found publicly on the stores we sell. Some examples are:
- Total sales in the past four months
- Average review score in the past 30 days
Besides
that, our entire catalog is publicly available at the stores. It’s just
a matter of building a web crawler to fetch that data. Product
description, price, photos, freight value and estimated delivery time
are all available at the marketplaces where we sell our products.
Even
if someone gets our catalog database by crawling the stores, we took
care to not allow anyone discovering which product was sold, you just
have a anonymized product_id. It is not possible to link our dataset to
any product catalog. The data has been anonymized, and references to the
companies and partners in the reviews text have been replaced with the
names of Game of Thrones great houses. We also sampled it in a way that
would not allow others taking any conclusion about our current business
size. Those cares had been taken, there was no other reason to hold the
data.
What we did wrong?
At
the first release we thought that it would be nice to remove complexity
from data. So we tried to join as many information as we could in just
one table. With time users starting to ask for new features, such as
customer, product and seller ids. We also decided to add more features
that we thought were important.
We
kept the original data structure (one main table) and added other
tables with those additional information. Soon enough we had added a lot
of new features. And the whole dataset was getting ugly: compound keys,
names without any convention and other messy stuff.
We
decided to fix that on the version 6 release. We split the whole
dataset in different tables, each one containing one aspect of an order.
Now the dataset looks more complex than it was before, but the
relationships between data are cleaner.
If
we could give any advice on this matter it would be to think right from
the beginning of a data structure that supports growth and addition of
more features. Because your data users will certainly ask for it.
A word of encouragement
We
would love to see more datasets like ours publicly available. Until now
we only had benefits by sharing the data, and it seems there won’t be
any drawbacks.
Right now we are already thinking of the next data ta will go public. How about you? Is there any data you would like to share?
Please contact us if you have any question or concern.
Comments
Post a Comment